GC TREND INFO
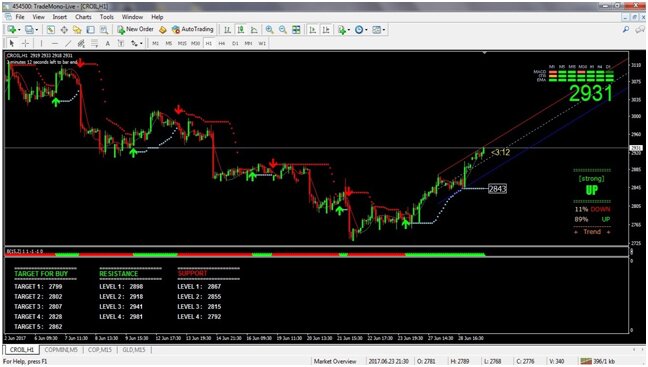
- Take an entry from next candle of the signal.
- Red and White dots showing trailing stop loss.
- Vertical white line is for day separator.
- Downtrend/Uptrend showing you the possibilities of market going to be up or down.
- 3 horizontal lines are of Customized trend channel.
- Red and Green arrows Indicates buy and sell signal.
- Digits in yellow color showing time left for close of current candle.
- Big Green digits showing you the current market price.
- For intraday positions, we suggest you to watch M15 Time Frame and For positional positions, we suggest you to watch H1/H4 Time Frame.
- Green candles showing you the Bullish candle and Red candle showing you the Bearish candle.
- 5 Targets are given, according to the Buy & Sell signal.
- White digits in white box showing you the current stop loss.
NOTE
Before taking Real Position according to Signals, We suggest you to do paper trades for Minimum 3 days to build confidence on strategy. It helps to understand real time market risk.
GC ANALYZER
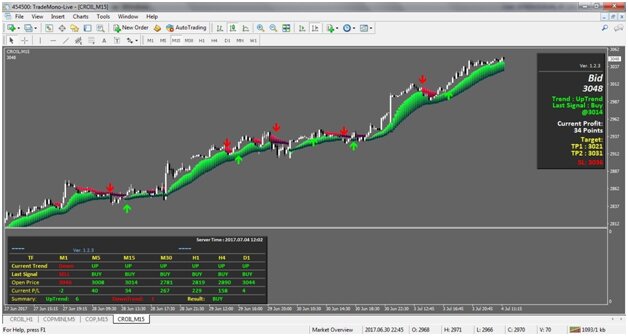
- Take an entry from next candle of the signal.
- Red and Green arrows are of buy and sell signal.
- Black candles showing you the Bearish candle and White candles showing you the Bullish candle.
- GC Analyzer has two Dashboards.
- First Dashboard shows you Bid/Ask rates, Trend, Last Signal, Current Profit Point from entry level, 2 Targets, & Stop Loss.
- Second Dashboard shows Current Trend, Last Signal, Open Price, Current Profit/Loss Points, and Overall Result according to different time frames.
NOTE
Before taking Real Position according to Signals, We suggest you to do paper trades for Minimum 3 days to build confidence on strategy. It helps to understand real time market risk.


Open Free Account